

Data


The intention of this project was to capture data to conclude the best materials and drag design for paper airplane construction. To achieve this, we needed to collect data that included mass, velocity, surface area, and distance. This experimental data allows us to perform drag analysis on various elevation angles as well as multiple material formats. Ultimately, this enables us to uncover the truths behind what makes a great paper airplane. Constructing the perfect paper plane is somewhat of an art form. Let us take you under our wing as we explore the possibilities of science and precision folding so that you too can learn the secrets of the paper plane craft!


Data Summary
We collected our data by using an air track and air cart as a launching system. This ensured a consistent release velocity and angle. We launched planes made of normal copy paper with rear elevator flaps at 0°, 30°, 60°, and 90° from the wing surface (see Figure 3). We also launched planes made of construction paper and card stock with 0° rear elevator flaps (see Figure 2). 10 tests were taken of each set up. They were launched with an initial height of 1 meter and we used a tape measure to see how far they landed from the table. We also used a GoPro to record the first 50 cm of flight and find the average velocity over this time.
Normal Paper: 4.45 grams
Construction Paper: 7.38 grams
Card Stock Paper: 10.64 grams

Normal Copy
Paper
Construction
Paper
Card Stock
Paper
Figure 2: We took data for 3 different types of paper: Normal Copy Paper, Construction Paper and Card Stock Paper. We used different paper to test different weights.
Figure 3: We took data for 4 different angles of rear elevator flaps for the normal paper: 0°, 30°, 60° and 90°.
0°
30°
60°
90°
Launching System
For data collection, we used an air track and cart to accelerate the planes from rest, to reach a constant release velocity. This was done using an air pulley at the end with film attaching the cart to a 147g weight. The weight was dropped 1m, thus accelerating the cart (see Figure 4).
The custom release system that we designed for the cart provided a level and straight support for the planes to slide out of upon the cart striking the track bumper. Consequently, this created a “channel” for the bottom edge of the plane to slide through. This system was beautifully fabricated with basic materials, including cardboard, index cards, and duct tape (see Figure 5).
To measure the distance each plane traveled, we placed a tape measure along the ground beneath the air track. When the plane left the cart, we watched to see where the plane landed. As soon as the front of the plane landed, we marked its location and used the tape measure to note the distance traveled (see Figure 8). This was logged in excel individually by trial, and then averaged (see Table 2).
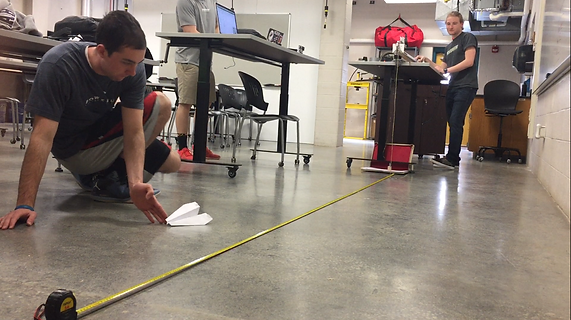

Figure 8: We secured a tape measure down to the floor in order to measure the distance from the launch point to where the front of the plane impacted the ground.
Table 2: Table of distances measured over 10 trials.
Distance Measurement
Velocity Measurement
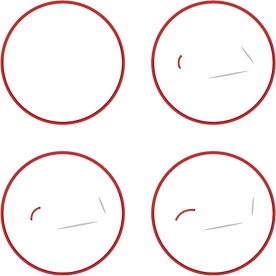
To measure velocity, we used a simple marking on a meter stick to indicate a distance of 50cm from the release point of the cart. Also, video was captured on a GoPro Hero 3, which allowed us to capture high definition 1080p at 59.94 fps (see Figure 6). This frame rate divided by the number of frames between release and arrival at our 50cm mark, provided us with time information that we could find upon further frame-by-frame analysis on a computer (see Figure 7). This distance information paired with the time information of the GoPro, enabled us to calculate an average velocity of each plane. This was used as our initial velocity since the time span was short and at the beginning of the flight prior to drag effects (see Table 1).


Table 1: Table showing how the number of frames between take off and 50cm relates to velocity.
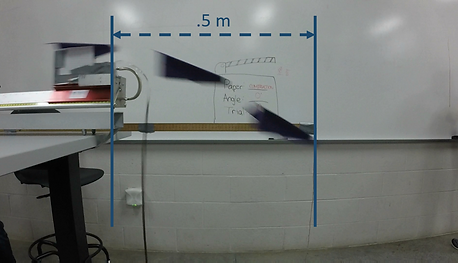
Figure 7: We counted the number of frames between the release point and our 50cm mark to calculate our velocity.
Figure 6: Video was recorded on a GoPro and the framerate was then used to calculate the velocity of the plane for each trial.
Drag Calculation
To calculate drag, we needed the drag coefficient, density of air, plane velocity and reference area. We assumed 0.07 for the drag coefficient. This was a pre-calculated value for paper airplanes. A link to the site can be seen below. We assumed the density of air to be 1.2041 kg/m^3 at room temperature. The velocity was calculated using the method stated above. The relative area is the area of the plane seen when it is flying directly at you. This was calculated by taking the area of the wings (see Figure 9) and multiplying it by the sine of the angle between the bottom of the plane and the wings (see Figure 10). The drag of the elevator flaps was taken into account by taking the area of the flaps (1.5 cm by 1 cm) and multiplying it by the sine of the elevator flap angle plus the angle between the bottom of plane and the wings. With all variables accounted for, the drag equation can quickly be solved in Excel for each trial (see Table 3).
Table 3: This table contains a sample calculation in excel of the drag involved in each trial.


Figure 9: We had to calculate the surface area of the wings to use in the drag equation.
Figure 10: We take the area of the wings and multiply it by the sine of the angle between the bottom of the plane and the wings.
Link for where we found the drag coefficient:


LAKE BENDER
-graphics/design
-video editing
-content writing
-plane setup/launch
-data collection

-data webpage layout
-excel tables/graphs
-data recording
-distance measuring
-data collection

-images/overlays
-frame rate analysis
-velocity calculations
-video capture
-data collection
CONNER REYER
GROUP CONTRIBUTIONS
VAUGHN CHAMBERS
Graphs and Data Link
Link to Full Data Set
Figure 11: This is the graph comparing distance of different weight papers (Normal, Construction, and Card Stock).
Figure 12: This is the graph comparing distance of different angled elevator flaps on normal paper (0°, 30°, 60° and 90°).
Figure 13: This is the graph comparing distance of different weight papers (Normal, Construction, and Card Stock).
Figure 14: This is the graph comparing distance of different weight papers (Normal, Construction, and Card Stock).
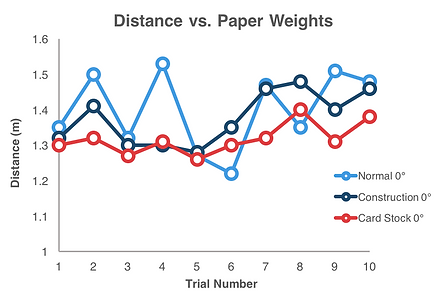


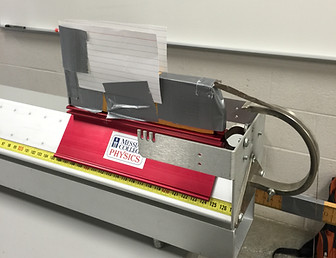
Figure 5: Pictured is the modified air track cart with cardboard and index cards to hold the airplane in place during launch.
Figure 4: We used an air track with a pulley to have the most controlled launch possible.