Reference Area
Combined Uncertainty: 365.37 mm^2

Flap Angle
Uncertainty: 10.65 mm^2
Table 7: Sources of error for elevator flap angle, as well as estimated uncertainty values for each error.

Surface Area Angle
Uncertainty: 365.20 mm^2
Table 8: Sources of error for wing angle relative to plane's base, as well as estimated uncertainty values for each error.

Surface Area
Uncertainty: 3.04 mm^2
Table 9: Sources of error for main surface area, as well as estimated uncertainty values for each error.
Distance
Combined Uncertainty: 0.0277 m


Distance Uncertainty Results
Figure 17: These are the relative uncertainties of distance in each of our experiment's tests using different elevator flap angles on standard paper.
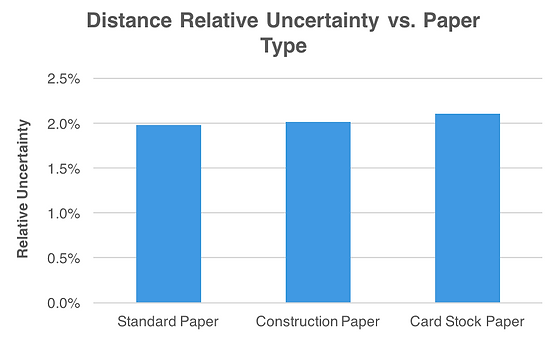
Figure 18: These are the relative uncertainties of distance in each of our experiment's tests using different types of paper.

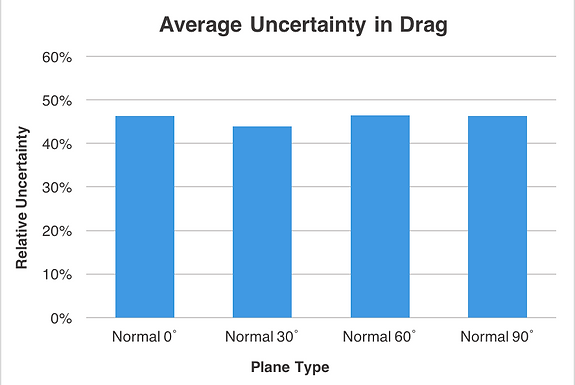
Drag Uncertainty Results
Note: y-axis does
not start at 0
Figure 15: These are the relative uncertainties of drag in each of our experiment's tests using different elevator flap angles on standard paper.
Figure 16: These are the UPC distribution of each variable in our drag equation. It is made clear that velocity is the largest source of uncertainty in our drag calculations, while air density had no effect on the output. Some ways to reduce the uncertainty in our velocity measurements would be to shoot video at a higher fps, or possibly measuring velocity with a more accurate device (ex. radar gun).


Distance
Uncertainty
Drag
Uncertainties

The goal of calculating the uncertainty is to be able to assess how accurate our data is. We want to see how our measurement tools affected our different outputs: drag and distance. The uncertainty in our velocity, coefficient of drag, air density, and wing area are taken into account to determine the overall uncertainty of our drag. The uncertainty in our distance is only affected by the tools used for measuring distance.
Goals of Uncertainty
Velocity
Coefficient of Drag
Air Density
Reference Area
Equations


Sources of Uncertainty for Drag

Uncertainty


Velocity
Table 4: Sources of error for velocity, as well as estimated uncertainty values for each error.
Combined Uncertainty: 0.737 m/s
Air Density
Combined Uncertainty: .00283 kg/m3
Table 5: Sources of error for air density, as well as estimated uncertainty values for each error.

Coefficient of Drag
Combined Uncertainty: .0103

Table 6: Sources of error for drag coefficient, as well as estimated uncertainty values for each error.
Table 10: Sources of error for our distance measurements, as well as estimated uncertainty values for each error.
After exploring the uncertainty in our project, we come up with a few major findings. First of all, when finding drag, the velocity accounts for almost all of the uncertainty. It is about 90% of the uncertainty, while drag coefficient, reference area, and air density account for the other 10%. Next, the uncertainty in the air density was basically 0%. Also, the relative uncertainty when calculating drag was between 40% and 50% for all four plane types that we measured drag for. This was a lot higher than expected, and as stated before this was mainly due to the velocity. The velocity had such a big impact since it was the only thing in the equation that was squared. This uncertainty could have reduced by using a more exact velocity measuring tool. We could have replaced the GoPro with a radar gun or something similar. For the distance uncertainty, this was very low as it was under 2% or just barely over 2% for all 6 plane types. We believe that we can still achieve our project goals with current uncertainty. Reducing the uncertainty would have made more accurate results possible, but it is not absolutely necessary for the success of this project.